
An Affinity Chart (also known as an Affinity Diagram) is a tool that is used to organize and classify ideas, thoughts and observations. It is often used to identify patterns and relationships in large amounts of qualitative data such as customer complaints, survey responses or brainstorming sessions. The goal of an Affinity Chart is to group similar ideas together in order to identify key themes and patterns that can be used to inform decision making.
This method is often used in brainstorming and problem-solving sessions, as it allows for the efficient grouping and categorization of ideas. The Affinity Chart can be used in a variety of settings, including business, education, and research.
Steps for creating Affinity Chart
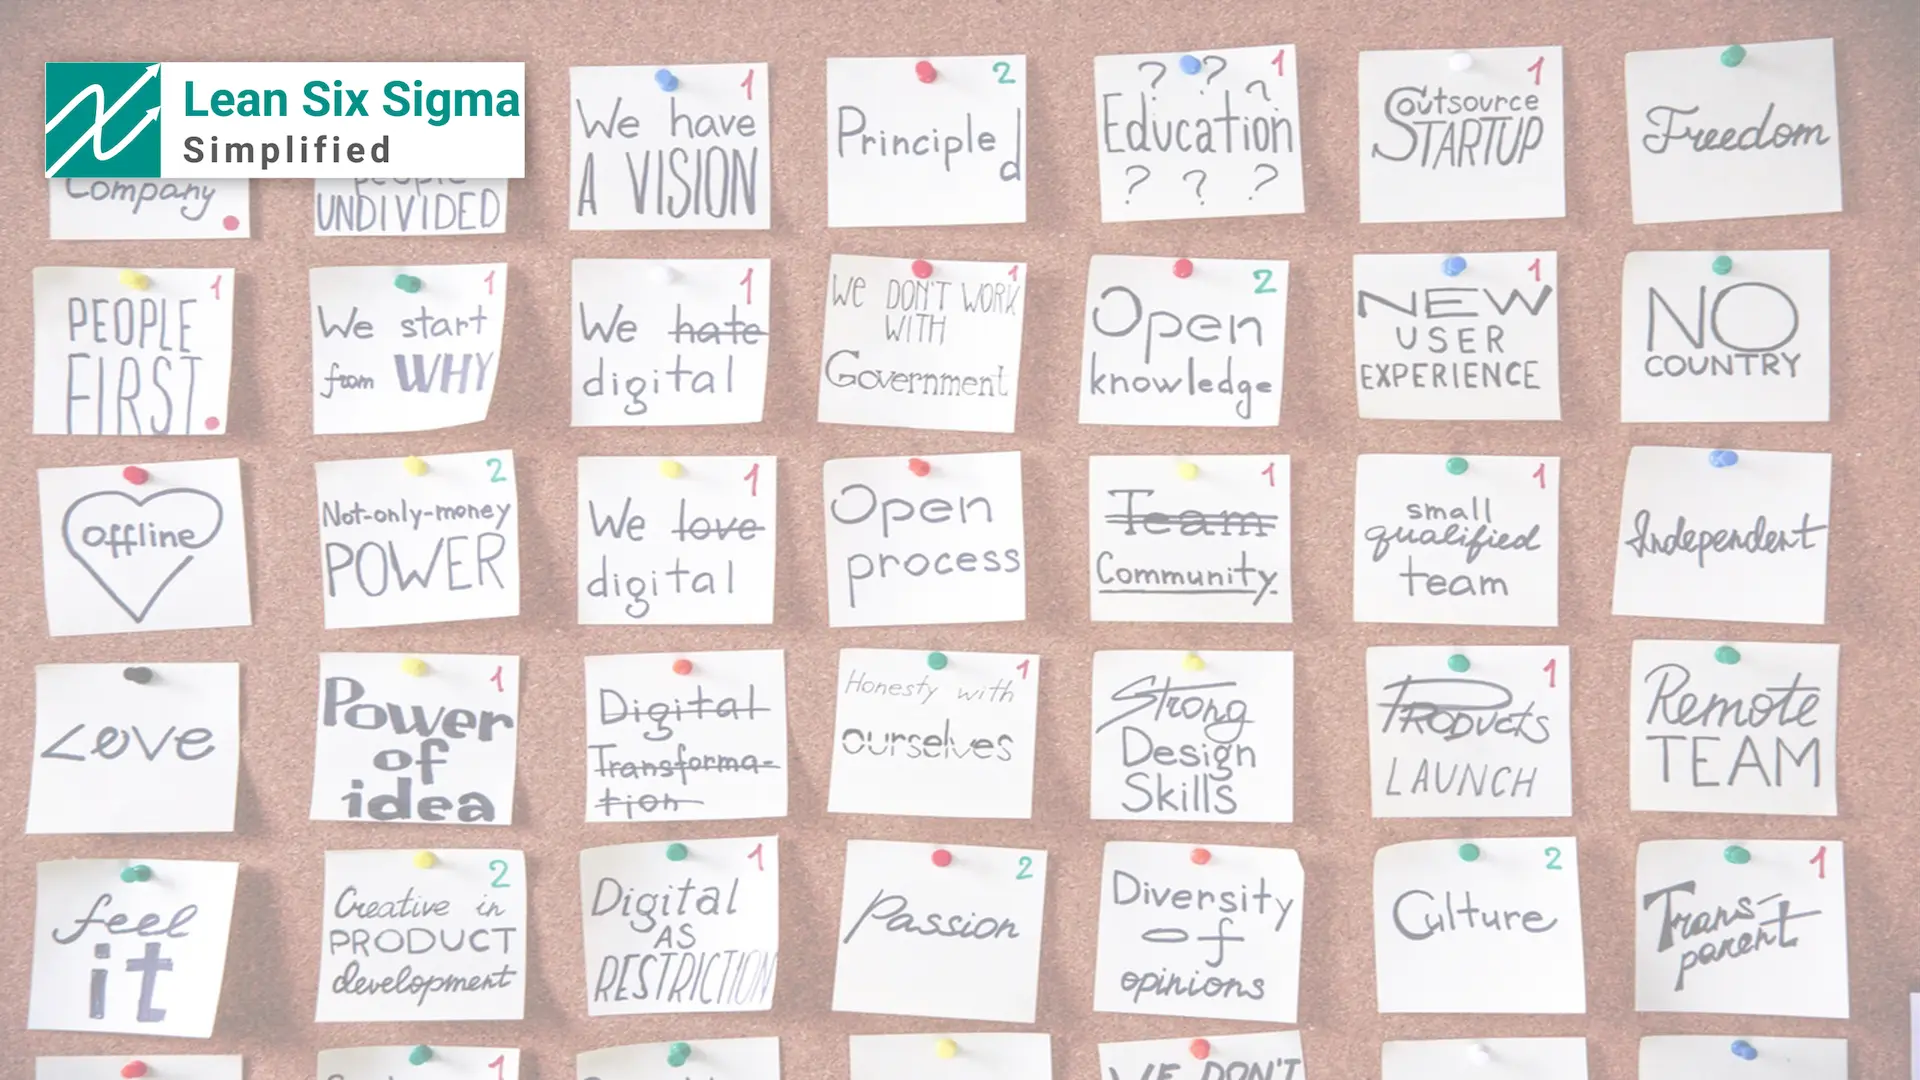
Collect Ideas: The first step in creating an Affinity Chart is to collect ideas. This can be done through brainstorming sessions, interviews, or any other method of idea generation. The ideas should be written down on sticky notes or index cards.
Place Ideas on a Surface: Once the ideas are collected, they should be placed on a wall or large surface, such as a whiteboard or poster board. It’s important to ensure that there is enough space for all the ideas to be placed and grouped.
Group Ideas: Next, participants should group the ideas based on their similarities and relationships. This can be done by having participants work in small groups or as a whole group. The goal is to group similar ideas together, creating clusters of related ideas.
Label Groups: Once the ideas are grouped, label each group with a descriptive name. This name should reflect the main theme or idea that the group represents.
Rearrange Ideas: Within each group, arrange the ideas in a logical order to create a flow. This will make it easier to understand the relationships between the ideas within each group.
Review and Refine: Review the final diagram and refine it as necessary. This can include re-grouping ideas, changing labels, or adding new ideas. It is important to ensure that the Affinity Chart is clear, concise, and easy to understand.
Use the Chart: The Affinity Chart can be used to identify patterns, trends, and relationships within the ideas. It can also be used to make decisions, identify potential solutions, or to plan next steps.
Benefits of Affinity Chart
Some of the benefits of using an Affinity Chart are listed below;
Clarity and Organization
An Affinity Chart allows for the organisation of large amounts of information in a clear and concise manner. This makes it easier for participants to understand the relationships between ideas and to identify patterns and trends.
Encourages Participation and Collaboration
The process of creating an Affinity Chart encourages participation and collaboration among team members. It allows for the input and grouping of ideas from multiple perspectives, which leads to more thorough and well-rounded solutions.
Time-saving
It can be a quick process to group and sort large amount of information. This makes it more efficient than other methods of organising data.
Flexibility
The Affinity Chart process is flexible and can be adapted to a variety of settings and contexts. It is useful for brainstorming, problem-solving, decision-making, and planning.
Identify patterns and trends
It allows to identify patterns and trends within the ideas. This can be useful for decision-making, identifying potential solutions, or for planning next steps.
Facilitation tool
The Affinity Chart can be used as a facilitation tool to guide the discussion and decision-making process. This can be especially helpful in a large group setting.
Improves Communication
It improve communication among team members, as it provides a visual representation of ideas and relationships. This makes it easy for everyone to understand and discuss.
Objective
Affinity chart process is objective and unbiased, as the ideas are grouped based on similarities and relationships rather than importance. This can be beneficial in a decision-making process.
By the way, do check out the Certified Lean Six Sigma Black Belt Handbook – it is one of the most essential guide for anyone trying to get certified as LSS Black belt or in general wants to understand LSS and improve processes. – check it out here.
Limitations of Using an Affinity Chart
- Time-consuming: If there are a large number of ideas to organise, the process of creating an Affinity Chart can take a significant amount of time. It can take a significant amount of time to group and label the ideas, and to arrange them in a logical order.
- Difficulty Identifying Most Important Ideas: As the groups are based on similarity and relationships rather than importance, it can be difficult to identify the most important or relevant ideas.
- Limited to Small Groups of Ideas: Affinity Chart is not suitable for a large number of complex data, as the number of groups may become too numerous to be manageable and the process can lose its effectiveness.
- Requires Physical Space: The process requires a physical space to place the ideas and group them, which may not be possible in a virtual or remote setting.
- Limited to a Specific Context: The Affinity Chart process is limited to a specific context and may not be appropriate for all situations. It’s important to consider the specific requirements and constraints of the project before deciding to use an Affinity Chart.
- Limited to a Specific Timeframe: Affinity Chart process is limited to a specific timeframe, so it may not be feasible for a long-term project.
Conclusion
Overall, the Affinity Chart is a valuable tool for organising and understanding large amounts of information. It is a simple and effective method for grouping and categorising ideas, and it encourages participation and collaboration among team members. While it does have some limitations, the benefits of using an Affinity Chart outweigh the drawbacks. It is a valuable tool for any organisation or individual looking to improve their problem-solving and decision-making capabilities.
Master Lean and Six Sigma Acronyms in No Time!
The Ultimate Guide to LSS Lingo – Yours for Free
Subscribe and Get Your Hands on the Most Comprehensive List of 220+ LSS Acronyms Available. No more searching for definitions, no more confusion. Just pure expertise at your fingertips. Get your free guide and other ebooks and templates today. Download Now!

Sachin Naik
Passionate about improving processes and systems | Lean Six Sigma practitioner, trainer and coach for 14+ years consulting giant corporations and fortune 500 companies on Operational Excellence | Start-up enthusiast | Change Management and Design Thinking student | Love to ride and drive

7 Principles of Lean

Origin of Lean

Next generation Lean Six Sigma – Harnessing the Power of AI

What is Lean Six Sigma and how it helps your career
Nominal Group Technique Definition, Examples Steps

What are the measures of Variation

What are the measures of Central Tendency
Normal Distribution for Lean Six Sigma

Probability Distribution for Lean Six Sigma
