
The 7 QC Tools, also known as the 7 Basic Tools of Quality, 7 New Tools and the 7 Quality Control Tools, are a set of simple yet powerful problem-solving and quality management tools recommended by Japanese engineering Professor Kaoru Ishikawa. These 7 QC Tools are designed to help organizations improve their performance and competitiveness by identifying and solving problems, and implementing solutions for improvement.
The 7 QC Tools are as listed below;
- Flowchart
- Check Sheet
- Control Chart
- Pareto Chart
- Histogram
- Scatter Diagram
- Cause and Effect Diagram
Below is the brief description of each of these 7 QC Tools.
Flowchart
A Flowchart is a diagram that illustrates the sequence of steps in a process. Teams use it to identify and understand the process, by showing the flow of inputs, processes, and outputs of a specific operation. Flowchart is a visual representation of the process, which comes in handy to identify bottlenecks, delays, and opportunities for improvement. It is easy to understand by team members with little technical knowledge. It is a simple but powerful tool to communicate the process with different functions or teams.
Check Sheet
A Check Sheet is a form used to collect and organise data. It is used to understand the process and identify problems by recording information such as quantity, frequency, and type of defects, or other parameters. It allows teams to quickly collect data and identify patterns and trends. This can help identify potential causes of a problem.
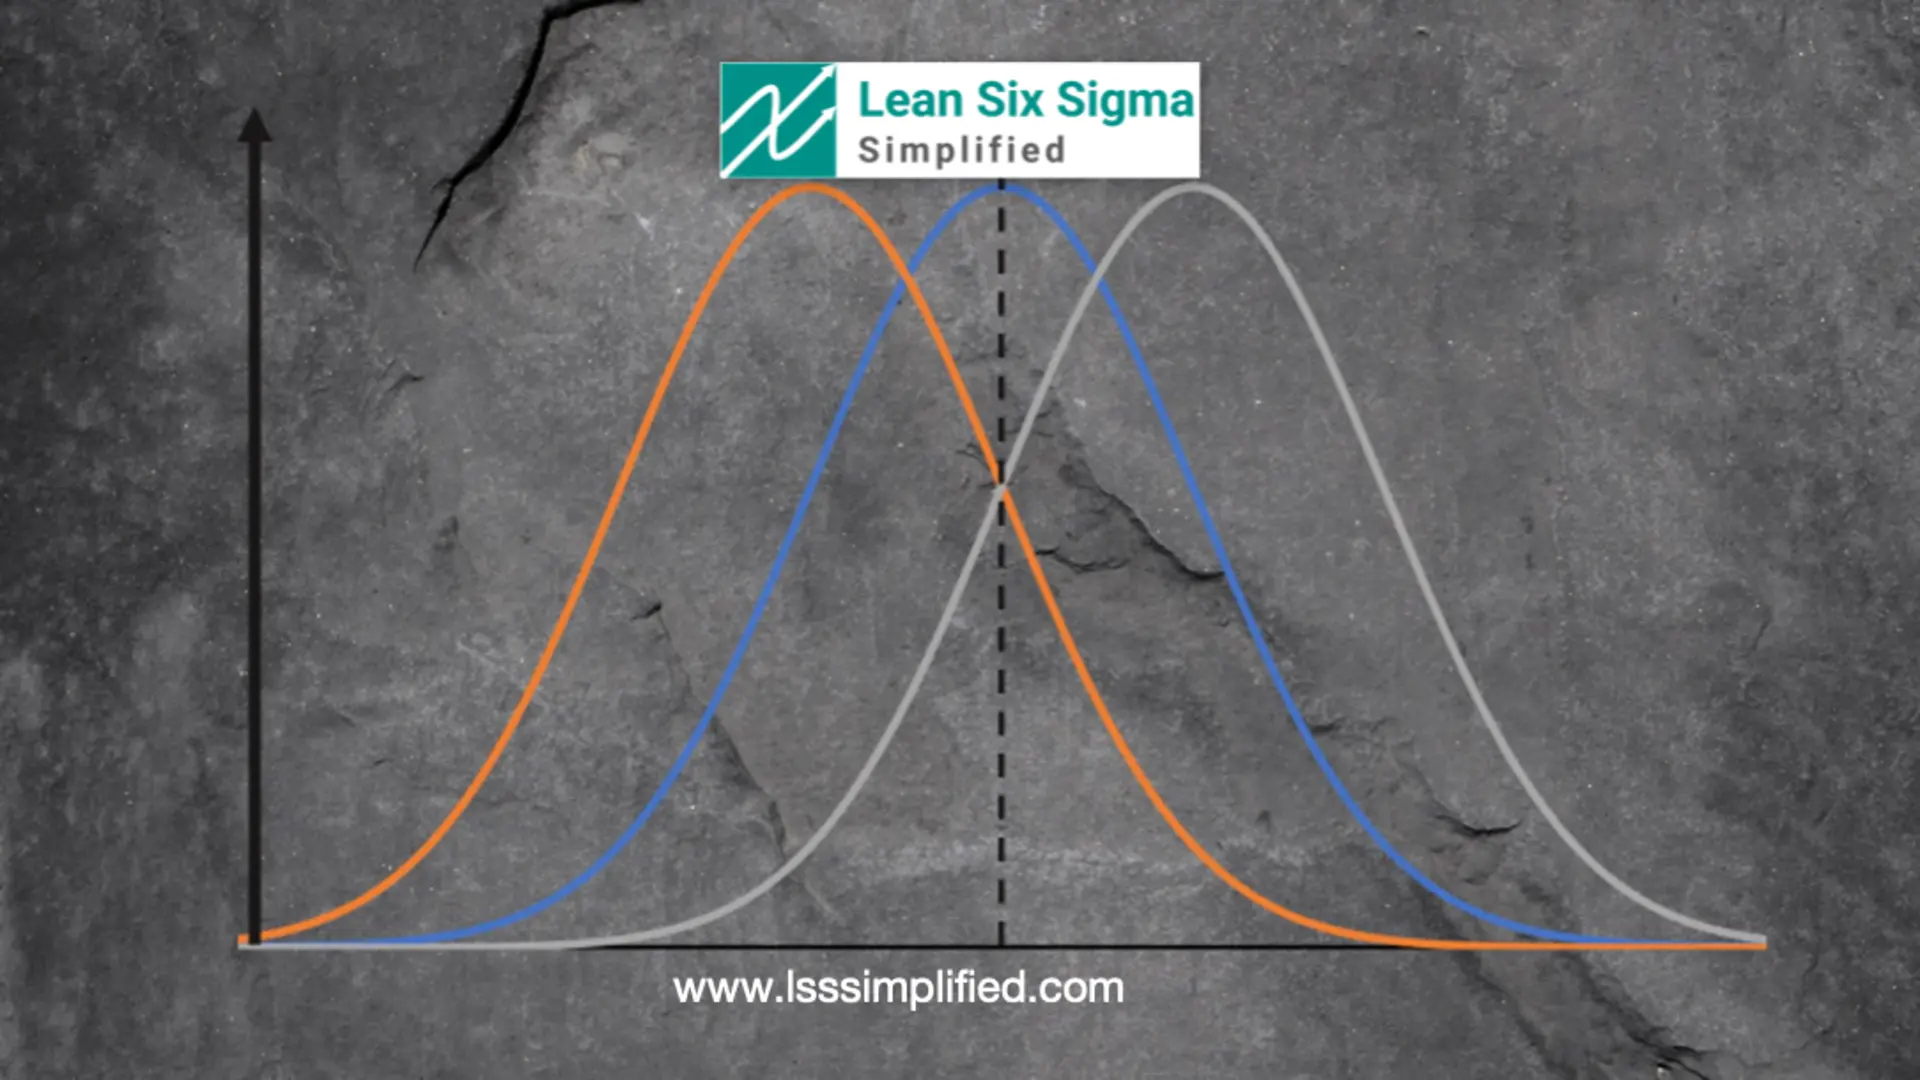
Control Chart
A Control Chart is a graphical representation of data over time. It is used to identify patterns and trends in the data. Also, Control charts are helpful to detect any unusual variations, and monitor the stability of a process. It is based on statistical process control and helps to understand the normal behavior of a process, to detect special causes of variation and track the process improvement over time.
Pareto Chart
A Pareto Chart is a graphical representation of the causes of a problem. It is used to identify the most important factors by showing the relative frequency of different problems or issues. It helps to prioritise problems based on their impact and to focus improvement efforts on the most important areas.
Histogram
A Histogram is a graphical representation of the distribution of data. Histograms come in handy to understand the process and identify problems by showing the frequency of different observations in a data set. It helps to identify patterns and trends in the data, and to understand the process variability.
Scatter diagram
A Scatter diagram is a graphical representation of the relationship between two variables. It is helpful to understand the process and identify problems by showing the correlation between two factors. It helps to identify patterns and trends in the data, and to understand how different factors are related.
Cause-and-Effect Diagram
A Cause-and-Effect Diagram, also known as a Fishbone diagram or the Ishikawa diagram, is a tool to identify the root cause of a problem by mapping out the relationship between an effect and its potential causes. It is often helpful in exploring the relationship between a problem and it’s possible causes, by identifying and analysing the various factors that may contribute to the problem. The cause-and-effect diagram uses a standard format of a “bone” shape, with the problem as the “head” and various branches representing different categories of possible causes such as materials, equipment, people, and methods. The tool allows teams to think in a structured and organised way, to consider all possible causes, and to focus on the most likely causes.
By the way, do check out the Certified Lean Six Sigma Black Belt Handbook – it is one of the most essential guide for anyone trying to get certified as LSS Black belt or in general wants to understand LSS and improve processes. – check it out here.
Conclusion
The 7 QC Tools (also known as the Seven Basic Tools of Quality and the 7 Quality Control Tools) are a set of simple yet powerful problem-solving and quality management tools recommended by Japanese engineering Professor Kaoru Ishikawa. These tools include Flowchart, Check Sheet, Control Chart, Pareto Chart, Histogram, Scatter diagram and Cause-and-Effect Diagram. These tools help organizations improve their performance and competitiveness by identifying and solving problems, and implementing solutions for improvement. They are easy to understand and use, which makes them accessible for team members with little technical knowledge. Organizations use these 7 QC Tools in combination, to provide a comprehensive and structured approach to problem-solving and improvement, and to continuously monitor and improve their process.
Master Lean and Six Sigma Acronyms in No Time!
The Ultimate Guide to LSS Lingo – Yours for Free
Subscribe and Get Your Hands on the Most Comprehensive List of 220+ LSS Acronyms Available. No more searching for definitions, no more confusion. Just pure expertise at your fingertips. Get your free guide and other ebooks and templates today. Download Now!

Sachin Naik
Passionate about improving processes and systems | Lean Six Sigma practitioner, trainer and coach for 14+ years consulting giant corporations and fortune 500 companies on Operational Excellence | Start-up enthusiast | Change Management and Design Thinking student | Love to ride and drive

7 Principles of Lean

Origin of Lean

Next generation Lean Six Sigma – Harnessing the Power of AI

What is Lean Six Sigma and how it helps your career
Nominal Group Technique Definition, Examples Steps
What are the measures of Variation

What are the measures of Central Tendency
Normal Distribution for Lean Six Sigma

Probability Distribution for Lean Six Sigma
